Counting the Voters

Half a million ballots were rejected between 2012 and 2022.

Whose were they?


Ballot Rejections in Washington State

Parrington Hall Building Exterior

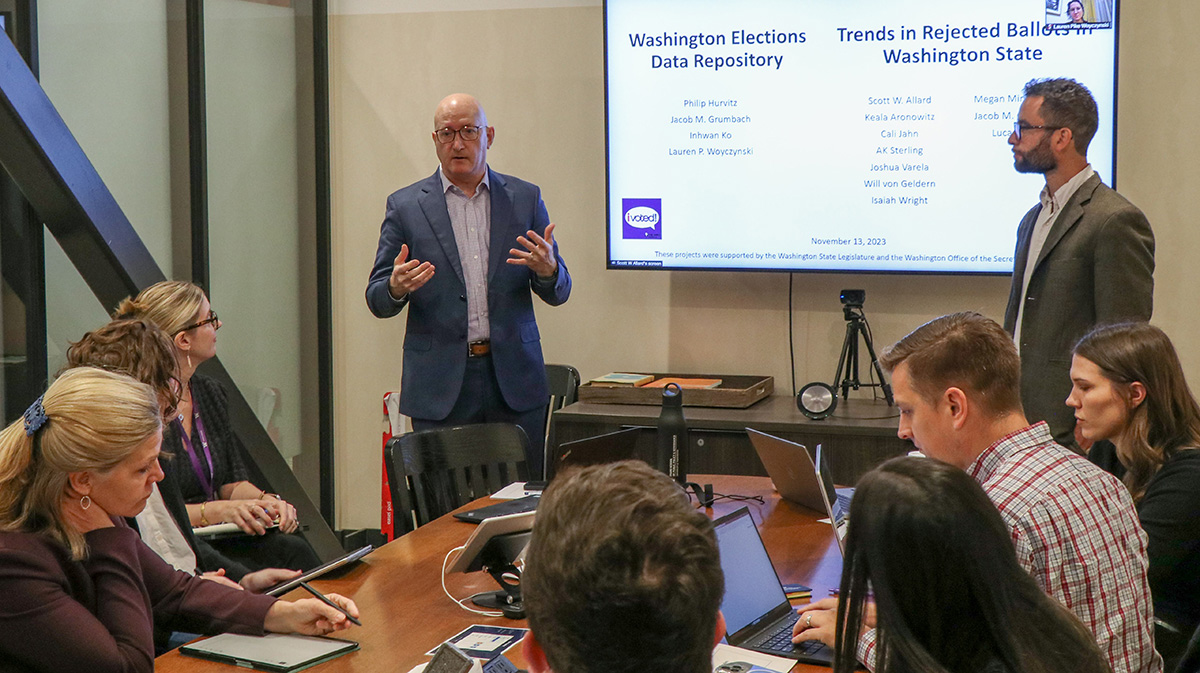
Parrington Hall, home to the Evans School of Public Policy and Governanace. Credit: University of Washington

Washington voters cast nearly 45 million ballots in primary and general elections between 2012 to 2022. Most of them — 98.9% of general election ballots and 98.5% of primary election ballots — were accepted. The Washington Secretary of State’s office wanted to find out why some ballots were rejected and what can be done to reduce rejection rates.

In 2022, the Office of the Washington State Auditor released a report analyzing Washington’s ballot rejection rates. The analysis highlighted evidence that may suggest signature rejections could occur at different rates for different demographics. The analysis could not find causality. To learn more, the Washington Secretary of State’s Office commissioned a study with the Evans Policy Innovation Collaboration (EPIC) at the University of Washington’s Evans School of Public Policy & Governance to peel back the data and find possible solutions. In November 2023, EPIC released its report, Understanding Patterns and Trends in Rejected Mailed Ballots in Washington State.

The EPIC Team

The EPIC Team in a meeting
Scott Allard and Jake Grumbach present the results of the Mail Ballot Project and Washington State Election Database to legislators and researchers. Credit: Bryce Erlandson

A team of nine cross-disciplinary researchers was assembled. Data scientists, public policy experts and election officials came together to find patterns and understand the trends in these rejected ballots. “We were really intentional and trying to make sure that we were bringing in researchers with different perspectives and different experiences,” said Scott Allard, the EPIC report’s primary researcher.

Schott Allard

Scott W. Allard

EPIC Report Primary Investigator
Associate Dean for the Evans School of Public Policy at the University of Washington

Calista Jahn

Innovation and Engagement Manager
EPIC Research Team at the University of Washington

Jake Grumbach

Jake Grumbach

Study Co-Author
Goldman School of Public Policy at University of California, Berkeley and Co-director of the Washington State Elections Database


Voting in Washington State

A vast majority of Washington’s voters use the state’s vote-by-mail system, over 98% according to data from the Washington Secretary of State’s office. Voters have more time to research candidates and initiatives because eligible registered voters receive their ballot at least 18 days before the election. Voting by mail also allows voters to turn in their ballot before Election Day. If a voter’s ballot is rejected, a voter can “cure” or correct their ballot to have it counted.

The vote-by-mail system also creates an auditable paper trail, and outer return envelopes can be traced back to voters’ names and addresses. This EPIC team used this paper trail to inform their research. Ballots themselves are still secret; once ballots are removed from the secrecy envelope, they cannot be traced to an individual voter.

Lifecycle of a Ballot

Finding Voter Demographics

Determining racial demographics in Washington is difficult. During the Civil Rights Movement, the federal government passed the Voting Rights Act of 1965, which required states covered under special provisions of the act to require racial data be collected or to request racial identification of voters. These provisions covered states that had a history of racial discrimination at the ballot box. The states covered under these provisions were often former Jim Crow states. Grumbach said, “Washington state, like most states that were not former Jim Crow states, [is] not covered by the Voting Rights Act, Section 5*,” and does not collect racial or ethnic data. Grumbach said because of this, the EPIC team had to use statistical tools to estimate an individual’s racial background.

*In 2013, The U.S. Supreme Court held in a 5-4 decision that the coverage formula in Section 4(b) used to determine which jurisdictions are subject to the preclearance requirement of Section 5 of the Voting Rights Act of 1965 was unconstitutional in Shelby County v. Holder, unless they are covered by a separate court order entered under Section 3(c) of the VRA.


The Data

Data falls into two overarching categories: quantitative and qualitative. Data can also be a mix of both.

Quantitative data is information that can be counted. Quantitative data counts the number of fish in a river, number of items stocked at a grocery store and number of ballots cast, for example. Qualitative data is information that cannot be counted. Qualitative data will tell you if the fish is a salmon or trout, what items are stocked at the grocery store and who cast the ballot.

Statistical Inferences and Probability

Because Washington state does not collect racial data of voters on the individual level, the EPIC team used a leading statistical technique called Bayesian Improved Surname Geocoding. “We know a little bit about where people live,” Allard said, “And we also have people’s surnames and can use data that helps us think about the likelihood that a voter would identify as Black, white, Hispanic or Asian based on where they live and their surname.” The BISG method uses a voter’s surname, census data and geography to determine the probability (P) a voter falls into a racial or ethnic group.

Grumbach shared an example of using the method to predict whether a voter is Hispanic.

To find this, he defined the variables as:

P(H|E): Probability a person is Hispanic given the person’s surname and geography

P(E|H): Probability somebody has this surname and geography given that this person is Hispanic

P(H): Probability a person is Hispanic

P(E): Probability a person has this surname and geography

To determine whether voter John Doe who lives in Yakima County is Hispanic, the equation would be:

This equation determines probability. Grumbach said that people may be surprised at how accurate the results it generates are but also notes they are not perfect. “It is difficult for any individual, particularly individuals that are in interracial or inter-ethnic marriages,” Grumbach said. “For racially mixed individuals like myself, I like to use my own example where my mother is Black and my dad is white.” The equation predicts Grumbach is a white man.

Data Findings

Ballot rejections in Washington are low, averaging less than 2% in both primary and general elections. A little over half of those ballots were rejected because they arrived late. Ballots must be postmarked or placed in a drop box by 8 p.m. on Election Day. The rest of the ballots were rejected for a variety of reasons, most often for signature mismatches or missing signatures. The EPIC team found that different demographic groups were affected at different rates. It estimates that in the 2020 November general election, 1.3% of ballots from Latino voters, 1.2% of ballots from Asian American voters and 0.9% of ballots from Black voters were rejected. White voters had their ballots rejected at a rate of 0.6%.

In an interview, Grumbach noted the complexity and distinctiveness of Asian American and Latino American surnames may lead to signature mismatches. The report cites this in line with interviews with county election officials. Many voters may go by anglicized names, nicknames or shortened versions of complex surnames in daily life, and their day-to-day signature may not match their legal name or signature they used on their vote registration. Using the wrong signature results in a rejection for mismatch. The report also cited voters who said that they do not have a “standard” signature. This often affects younger voters whose signatures are still developing and may vary when they are signing their driver’s license, credit card receipts, voter registrations or ballot return envelopes. This also can result in a signature mismatch.

Rejection rates vary year-to-year and county-by-county. The study found that 1.1% of all ballots in 2012 and 1.5% of all ballots in 2022 were rejected in general and primary elections statewide. According to the study, Benton County had a rejection rate of just 0.3% in the 2012 general election but in 2016 had a rejection rate of 2.6%.

The February 2022 Auditor’s Report that informed the EPIC study claimed the office could not find evidence of conscious bias. Allard said that could mean bias may be built into the system itself.

We think that they reflect structural racism and the legacy of policies and institutions that have disenfranchised people of color over time.

And disparities — whether caused by conscious or unconscious bias — are still a problem according to Jahn, the Innovation and Engagement Manager for the Evans School. “It is incredibly important that we understand whether all races are able to participate fully, or whether any government processes that we have instituted are systematically leaving certain people out,” she said.


Solutions and Recommendations

One disparity, age, helped the team zero in on a possible cause of ballot rejections: experience and accessibility.

Age shows the largest disparity in rejection rates. Nearly 5% of voters ages 18-25 had their ballots rejected, much higher than the rejection rates for voters ages 46-65 (0.8%) and voters ages 66 and over (0.3%). Allard said that this helped the team zero in on the problem and informed their solution. That solution is a design update.

Reducing the Rejection Disparity

Counties design their own ballot return envelopes. A complete systematic review of return envelope design found the 15 counties with the lowest rejection rates have similar envelope design elements that make them easier to read. Grumbach said, “We’re absolutely brainstorming different potential solutions, and some seem really doable for how to reduce mail ballot rejection rates across groups.” The team believes small visual nudges would be effective.

The report cited county elections officials who pointed out that language used on ballots can be unclear and intimidating, particularly to English as a Second Language voters and first-time voters. This is consistent with research from the Center for Civic Design.

Five Design Updates to Reduce Ballot Challenges

Using these design principles, the EPIC team envisioned a ballot return envelope design that could be standardized across the state.

Future Research

Going forward, the EPIC team suggests a number of next steps, including continuing research into rates of ballot rejection by voter race and collaborating with Tribes to identify barriers facing Indigenous voters in Washington. The team also suggests conducting research into whether local context, like ballot drop box locations or competitive local elections, affect rejection and cure rates or if cure notices are effective. Another recommendation is bolstering election funding and strengthening administration practices. The team also points toward a stronger role for community-based organizations and voter education.

The entire EPIC report Understanding Patterns and Trends in Rejected Mailed Ballots in Washington State can be found on the Washington State Ballots Project webpage from the Evans School of Public Policy & Governance.

This story was produced in collaboration with
Nova Logo
I would like to support:
Welcome to the new digital home of Northwest Public Radio and Northwest Public Television. The new year brings an internal change to our organization, joining TV and radio. Together, we’re NWPB. Thank you for your continued support of public broadcasting in our region. Your support matters.
NWPR Logo
NWPB Logo
NWPTV Logo
Thanks for visiting www.nwpb.org. It looks like you might have an Ad Blocker enabled. Please whitelist www.nwpb.org to ensure that you are receiving the fully uncompromised interactive experience.

Click here for help whitelisting NWPB.org.