Listen
(Runtime 1:37)
Read
Predicting natural disasters is not an exact science. Still, crucial and organized data can give some insights into where a wildfire could occur.
Researchers from Idaho and Oregon participated in research to improve the Fire Program Analysis Fire Occurrence Database, or FPA-FOD, which contains historical data on more than two million wildfires in the United States. These improvements might be the key to better predicting wildfires in the Northwest.
Erica Fleishman is the director of the Oregon Climate Change Research Institute. She’s also a professor at Oregon State University.
"We're not saying it's going to happen here next Tuesday at three in the afternoon, but we're saying these are circumstances that historically have made wildfires more likely," Fleishman said.
The researchers used the original FPA-FOD wildfires database, created by Karen Short, a researcher with the United States Department of Agriculture, in 2013. It contains information on wildfires that occurred in the country between 1992 and 2020.
According to the USDA, the original database has been updated five times. The information comes from wildfire reports from federal, state and local fire organizations.

Yavar Pourmohamad is a doctoral student at Boise State University. He and his adviser, Boise State University's associate professor Mojtaba Sadegh, led the research team.
Pourmohamad, Sadegh, Fleishman and other researchers recently added over 200 features to the existing Fire Occurrence Database data on U.S. wildfires.
"We can categorize it in the four sections of the weather and climatic variables, land cover and topography, social and administrative parameters," Pourmohamad said.
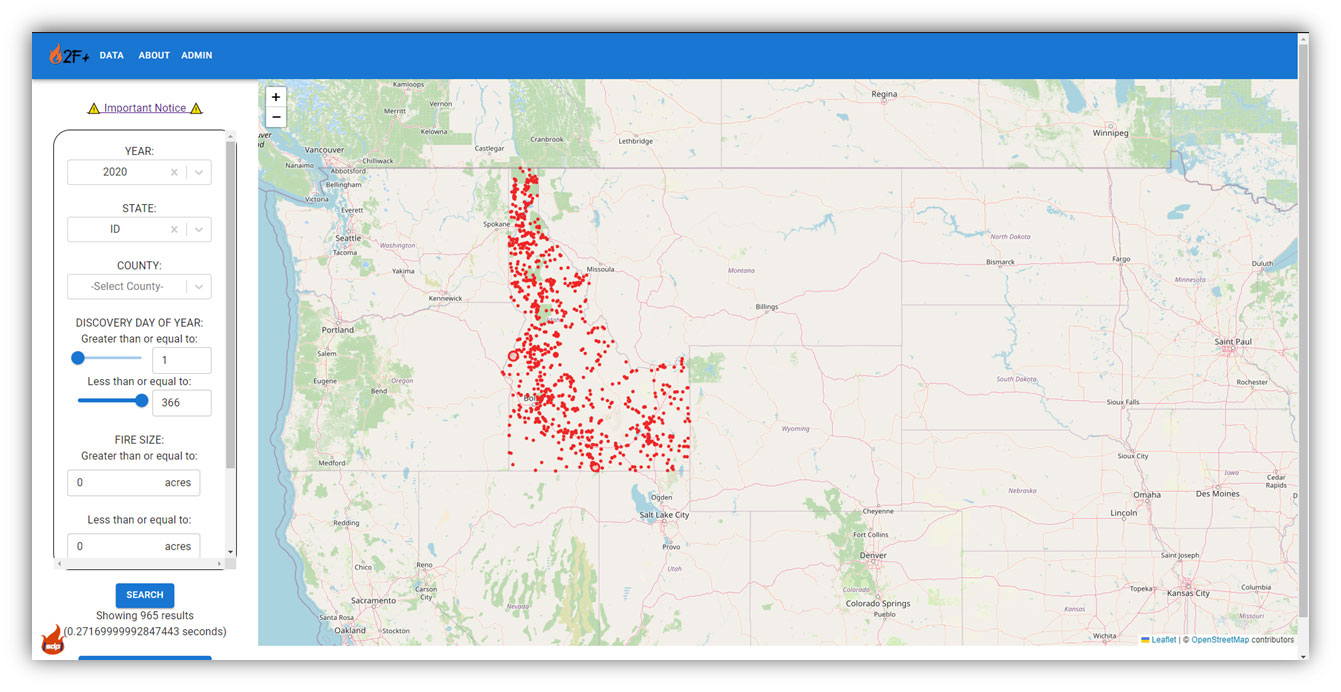
The group created 2F+, an interactive visualization map showing different attributes of the FPA-FOD dataset. Researchers and collaborators from at least eight universities and organizations participated.
"We are using the AI (Artificial Intelligence) to look at all the aspects that we are giving the model to analyze it for us and give us the probability. What's the chance of a starting fire in one location?" Pourmohamad said.
Pourmohamad said predicting wildfires is like finding illness risk factors in a human body.
"Someone who never worked out, didn't take care of the body, smokes every day, drink alcohol … he put himself in the danger prone for any kind of disaster," he said. "The environment is kind of the same. There are lots of fuel loads on the ground, very hot and dry days, dead fields and they just need an ignition to disaster starts."
Pourmohamad said the new information will help better understand various attributes and their impact on how wildfires start and grow. He said it might also make a difference in making decisions to allocate resources for fighting wildfires quickly.
Fleishman said the enhanced database can also help to improve policy changes.
"The more is known, at least in some parts of the country, there are policy changes to try to better protect people," Fleishman said.
She explained that aspects of wildfires, like smoke, still need to be included in policies related to natural disasters.
"Smoke isn't necessarily destroying things in the same way that flames are. It is not as visible, but it's a tremendous threat and costs a lot of money," Fleishman said. "Wildfire smoke is becoming a greater public health threat."
Pourmohamad said an essential next step in the research is to fill in the gaps of missing wildfire information, which is not always accessible regarding data collection in the land base.
"We need some agents going to the field, finding the location of the wildfire recorded, do some investigation to find out what's the exact reason of the wildfire that happens," he said.
Pourmohamad said the interactive map allows people to view fire information by state and county. They can also filter by adding different attributes. He also said the group is working on another map that will show where fires are likely to occur.